The prebuilt Results screen appears after a search to list and map results. See the following to customize the screen:
● behavior
Notes
● See the features and relationships of prebuilt screens.
● See how to customize the dark theme for screens and map.
The Results screen comes with list and map views and adjusts to fit different sizes of the screen.
● List view on screen – See the following to customize content for the list view.
● Map view on screen – See the following to customize content for the map view.
Content on the Results screen is displayed in the following order ...
1. Search block
... and then remaining content for listing and mapping results of a search:
2. List view
3. Map view (including zoom level)
Note
● Selecting
the back icon (![]() ) displays previous screen.
) displays previous screen.

● This block is conditionally displayed on top of the Results screen:
o block is not displayed on the screen at its minimum size (such as on a mobile device)
o all fields in block are displayed vertically on the screen between its minimum and full sizes
o all fields in block are displayed horizontally on the screen at its full size
● Learn more about the Search block to customize it.
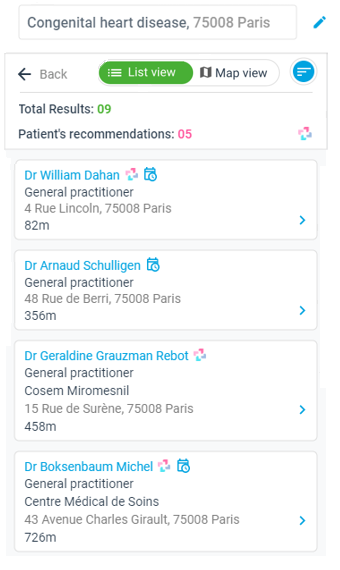
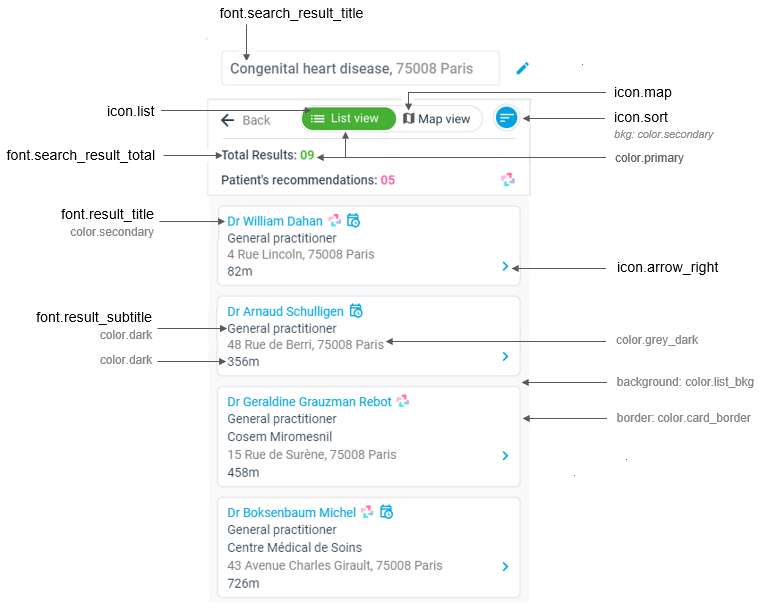
● The list view is the default view.
● Above the results, the following is displayed:
o total number of results (up to a maximum of 50 results)
o switch
(![]() ) to toggle between list and map views
) to toggle between list and map views
o button
(![]() ) to display the
Sort dialog with options for sorting results
) to display the
Sort dialog with options for sorting results
● Each result
is listed with a mini profile (card with arrow ![]() ).
).
o selecting mini profile in list displays full profile on the HCP profile screen
● Scrolling through results is done vertically.
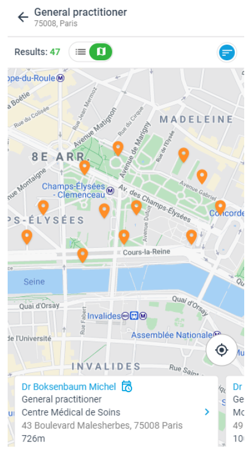
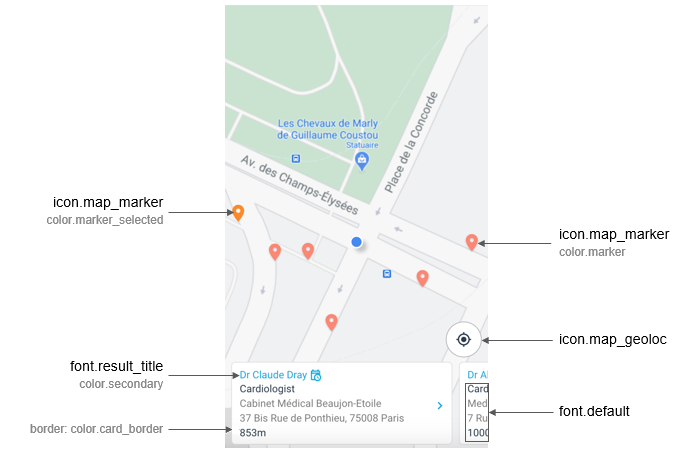
● The map view is the optional view.
● Above the results, the following is displayed:
o total number of results (up to a maximum of 50 results)
o switch
( ) to toggle between list and map views
o button
(![]() ) to display the
Sort dialog with options for sorting results
) to display the
Sort dialog with options for sorting results
● Each result
is listed with a mini profile (card with arrow ![]() ) and
mapped with a marker (
) and
mapped with a marker (![]() ):
):
o selecting marker on map moves mini profile to first position in list
o selecting mini profile in list displays full profile on the HCP profile screen
● Scrolling through results is done:
o horizontally across bottom of map (minimum size)
o vertically next to map (full size)
● Map behavior:
o zoom level of map is automatically adjusted to display results of search
o displays markers on map according to each result
o selecting a result's marker on the map moves the result to first position in list
o color of a result's marker selected on map is the same color as its mini profile in list
o the target
icon (![]() ) is used to adjust focus of map to current position
of user
) is used to adjust focus of map to current position
of user
o each movement
from current position displays the relaunch button (![]() )
to prompt relaunch of the same search based on new position on map
)
to prompt relaunch of the same search based on new position on map
o address of the map's center point is updated at the top of the screen
Zoom level of map is automatically adjusted to display results of a search near an address or user (near me) location. For details, see the following uses cases.
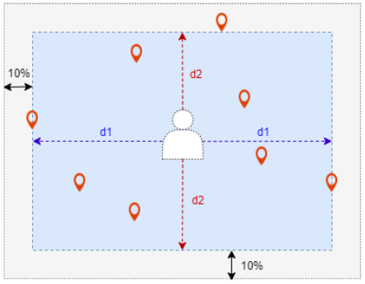
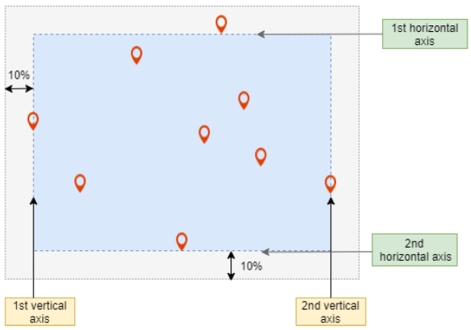
Your app can calculate the zoom level using addresses of results with the farthest latitude and longitude locations to form a rectangular area around remaining results. Specifically, your app uses the farthest locations ...
north to draw the 1st horizontal axis
south to draw the 2nd horizontal axis
west to draw the 1st vertical axis
east to draw the 2nd vertical axis
... to define 4 horizontal-vertical axes of the rectangular area (plus 10% padding) in which markers representing addresses of all results appear on the map.
For example, 5 HCP addresses with latitude and longitude ...
Latitude |
Longitude |
10.761816145589531 |
106.64792863824078 |
10.758798368428087 |
106.66046690761532 |
10.770942052527154 |
106.65952740984221 |
10.763280597296221 |
106.67027770319247 |
10.757322730990522 |
106.66548800286323 |
... are calculated to define the appropriate zoom level (zoom level 14 in this case) to show markers for all addresses.
Similar to use case 1, but your app takes current position of user as the center point on the map and computes it with distances (d1 and d2) symmetrically drawn to addresses of results with the farthest latitude and longitude locations to form a rectangular area around remaining results.